| 2.5. Histogram dialog | ||
|---|---|---|
 |
2. Image Structure Related Dialogs |  |
| 2.5. Histogram dialog | ||
|---|---|---|
| |
2. Image Structure Related Dialogs | |
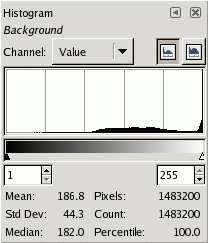
The Histogram dialog shows you information about the statistical distribution of color values in the image that is currently active. This information is often useful when you are trying to color balance an image. However, the Histogram dialog is purely informational: nothing you do with it will cause any change to the image. If you want to perform a histogram-based color correction, use the Levels tool.
This is a dockable dialog; see the section on Dialogs and Docking for help on manipulating it. It can be activated in two ways:
From the Toolbox menu: → →
From the image menu: →
In GIMP, each layer of an image can be decomposed into one or more color channels: for an RGB image, into R, G, and B channels; for a grayscale image, into a single Value channel. Layers that support transparency have an additional channel, the alpha channel. Each channel supports a range of intensity levels from 0 to 255 (integer valued). Thus, a black pixel is encoded by 0 on all color channels; a white pixel by 255 on all color channels. A transparent pixel is encoded by 0 on the alpha channel; an opaque pixel by 255.
For RGB images, it is convenient to define a Value "pseudochannel". This
is not a real color channel: it does not reflect any information stored
directly in the image. Instead, the Value at a pixel is given by the
equation V = max(R,G,B).
Essentially, the Value is what you would get at that pixel if you
converted the image to Grayscale mode.
For more information on channels, please consult the Section 1, “ Image Types ”.
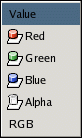
This allows you to select which channel to use. The possibilities depend on the layer type of the active layer. Here are the entries you might see, and what they mean:
For RGB and Grayscale images, this shows the distribution of brightness values across the layer. For a grayscale image, these are read directly from the image data. For an RGB image, they are taken from the Value pseudochannel.
For an indexed image, the "Value" channel actually shows the distribution of frequencies for each colormap index: thus, it is a "pseudocolor" histogram rather than a true color histogram.
These only appear for layers from RGB images. They show the distribution of intensity levels for the Red, Green, or Blue channels respectively.
This shows the distribution of opacity levels. If the layer is completely opaque or completely transparent, the histogram will consist of a single bar on the left or right edge.
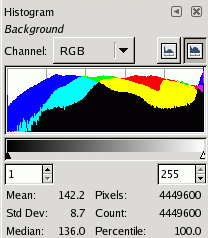
This entry, only available for RGB layers, shows the R, G, and B histograms superimposed, so that you can see all of the color distribution information in a single view.
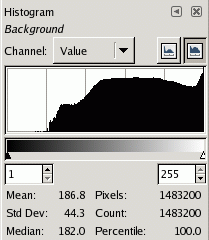
These buttons determine whether the histogram will be displayed using a linear or logarithmic Y axis. For images taken from photographs, the linear mode is most commonly useful. For images that contain substantial areas of constant color, though, a linear histogram will often be dominated by a single bar, and a logarthmic histogram will often be more useful.
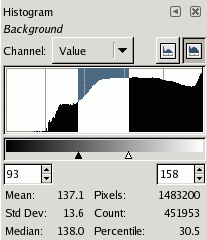
You can restrict the analysis, for the statistics shown at the bottom of the dialog, to a limited range of values if you wish. You can set the range in one of three ways:
Click and drag the pointer across the histogram display area, from the lowest level to the highest level of the range you want.
Click and drag the black or white triangles on the slider below the histogram.
Use the spinbutton entries below the slider (left entry: bottom of range; right entry: top of range).
At the bottom of the dialog are shown some basic statistics describing the distribution of channel values, restricted to the selected range. These are the mean, standard deviation, and median of the selected histogram portion; the number of pixels in the image; the number whose values fall within the selected range; and the percentage whose values fall within the selected range.