| 5.7. Curves Tool | ||
|---|---|---|
 |
5. Color Tools |  |
| 5.7. Curves Tool | ||
|---|---|---|
| |
5. Color Tools | |
You can get to this tools in two ways :
In the image menu through → → .
By clicking on the tool icon
 in Toolbox, if this tool has ben installed there (see
Tools dialog.
in Toolbox, if this tool has ben installed there (see
Tools dialog.
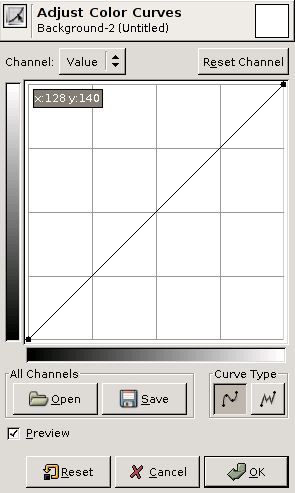
There are five options: Value for luminosity and contrast; Red, Green, and Blue for saturation; and Alpha (if your image has an Alpha channel).
This button deletes all changes made to the selected channel and returns to default values.
These buttons allow to choose the Linear or Logarithmic type of the histogram. You can also use the same options in Tool Options dialog.
Input and Output Value Domains : The horizontal bar (x-axis) represents input values (they are value levels from 0 to 255). The vertical bar (y-axis) is only a scale for output colors of the selected channel.
The control curve is drawn on a grid and goes from bottom left corner to top right corner. Pointer x/y position is permanently displayed in top left part of the grid. If you click on the curve, a Control point is created. You can move it to bend the curve. If you click outside of the curve, a control point is also created, and the curve includes it automatically.
So, each point of the curve represents an 'x' level, corresponding to an 'y' color. If, for example, you move a curve segment to the right, i.e to highlights, you can see that these highlights are corresponding to darker output tones and that image pixels corresponding to this curve segment will go darker. With color channels, moving right will decrease saturation and can reach the complementary color.
To delete all control points (apart from both ends), click on the Initialize Channel button. To delete only one point, move it onto another point or to grid border.
Open: This button allows you to select a file holding curve settings.
Save: Allows you to save any curves you have set to a file that can be loaded later.
Smooth: This mode constrains the curve type to a smooth line with tension. It provides a more realistic render than the following.
Free: You can draw your curve free-hand with the mouse. With curve segments scattered all over the grid, result will be surprising, but poorly repeatable.
The Preview button makes all changes to the levels dynamically so that the new level settings can be viewed immediately.
Tool Options dialog
Although this tool is not present in Tool box, nevertheless it has a Tool Option Dialog under the Toolbox. These options are described here:
These two options have the same action as the logarithmic and Linear buttons in the Curves dialog.
This slider sets the “radius” of the color-picking area. This area appears as a more or less enlarged square when you maintain the click on a pixel.